Usage
Installation
geolayerBDAP cannot be installed autonomously. It is already pre-installed inside the JEO-lab docker images of the BDAP platform.
Display raster datasets
To display a raster dataset, the rasterlayer class can be used. The supported input formats are all those managed by GDAL, like .tif, .vrt, etc.
Raster files are made-up of pixels that can store categorical values (usually an integer defining a class) or physical values (an integer or a floting point value representing a measurement): both types of raster datasets can be displayed using the geolayerBDAP library.
Various display modes are possible:
single band display using a continuous color palette
single band display using a colormap (a dictionary that assigns a color to each of the classes of a categorical raster)
RGB compositions combining three raster bands
specific display modes for Sentinel-2 products:
single band
RGB composition
Index calculation (i.e. NDVI)
Display vector datasets
To display a vector dataset, the vectorlayer class can be used.
Note
Vector symbology format
Inside BDAP, vector datasets are rendered using a dynamic tile server that converts vector features into raster tiles using the Mapnik library
In geolayerBDAP, a symbol is a list of lists of items each having 3 elements: [SymbolizerName, KeyName, Value].
Each list inside the symbol is mapped into a style (from style0 to style9), thus allowing for overlapped symbols
Example: a symbol for polygon features that are rendered by filling the area in red color (#ff0000) with borders in black
symbol = [
            [
               ["PolygonSymbolizer", "fill", '#ff0000'],
               ["PolygonSymbolizer", "fill-opacity", 0.3],
               ["LineSymbolizer", "stroke", "#010000"],
               ["LineSymbolizer", "stroke-width", 2.0]
            ]
]
Example on how to manage symbology: create a vectorlayer instance to display a shapefile, then assign the symbology to all the feature or only to a subset of the features, filtered with a clause in its attributes:
vlayer = vectorlayer.file('path to a .shp file', epsg=4326)
vlayer.symbologyClear()

# Apply symbol to all features of the vectorlayer
vlayer.symbologyAdd(symbol=symbol)

# Apply symbol only to features that are filtered by the rule on attributes
vlayer.symbologyAdd(rule="[CNTR_CODE] = 'IT'", symbol=symbol)

# If m is an instance of ipyleaflet.Map class, add the vector layer to the map
m.add(vlayer.tileLayer())
For a complete guide of the mapnik filter syntax, see the Mapnik Filter syntax page
When creating legend of symbols, it can be useful to use “parametric” symbols. These are symbols where some of the visual attributes are written in a generic manner, by using some predefined keywords (like ‘COLOR’, ‘FILL-COLOR’, ‘FILL-OPACITY’, ‘STROKE-COLOR’, ‘STROKE-WIDTH’, etc.). The static method vectorlayer.symbolChange can be used to change a parametric symbol.
Example:
# Parametric symbol using FILL-COLOR
symbol = [
            [
               ["PolygonSymbolizer", "fill", 'FILL-COLOR'],
               ["PolygonSymbolizer", "fill-opacity", 0.3],
               ["LineSymbolizer", "stroke", "#010000"],
               ["LineSymbolizer", "stroke-width", 2.0]
            ]
]

# Instantiate the symbol by substituting 'FILL-COLOR' with 'red'
s = vectorlayer.symbolChange(fillColor='red')

vlayer.symbologyAdd(s)
Create symbols for vector datasets
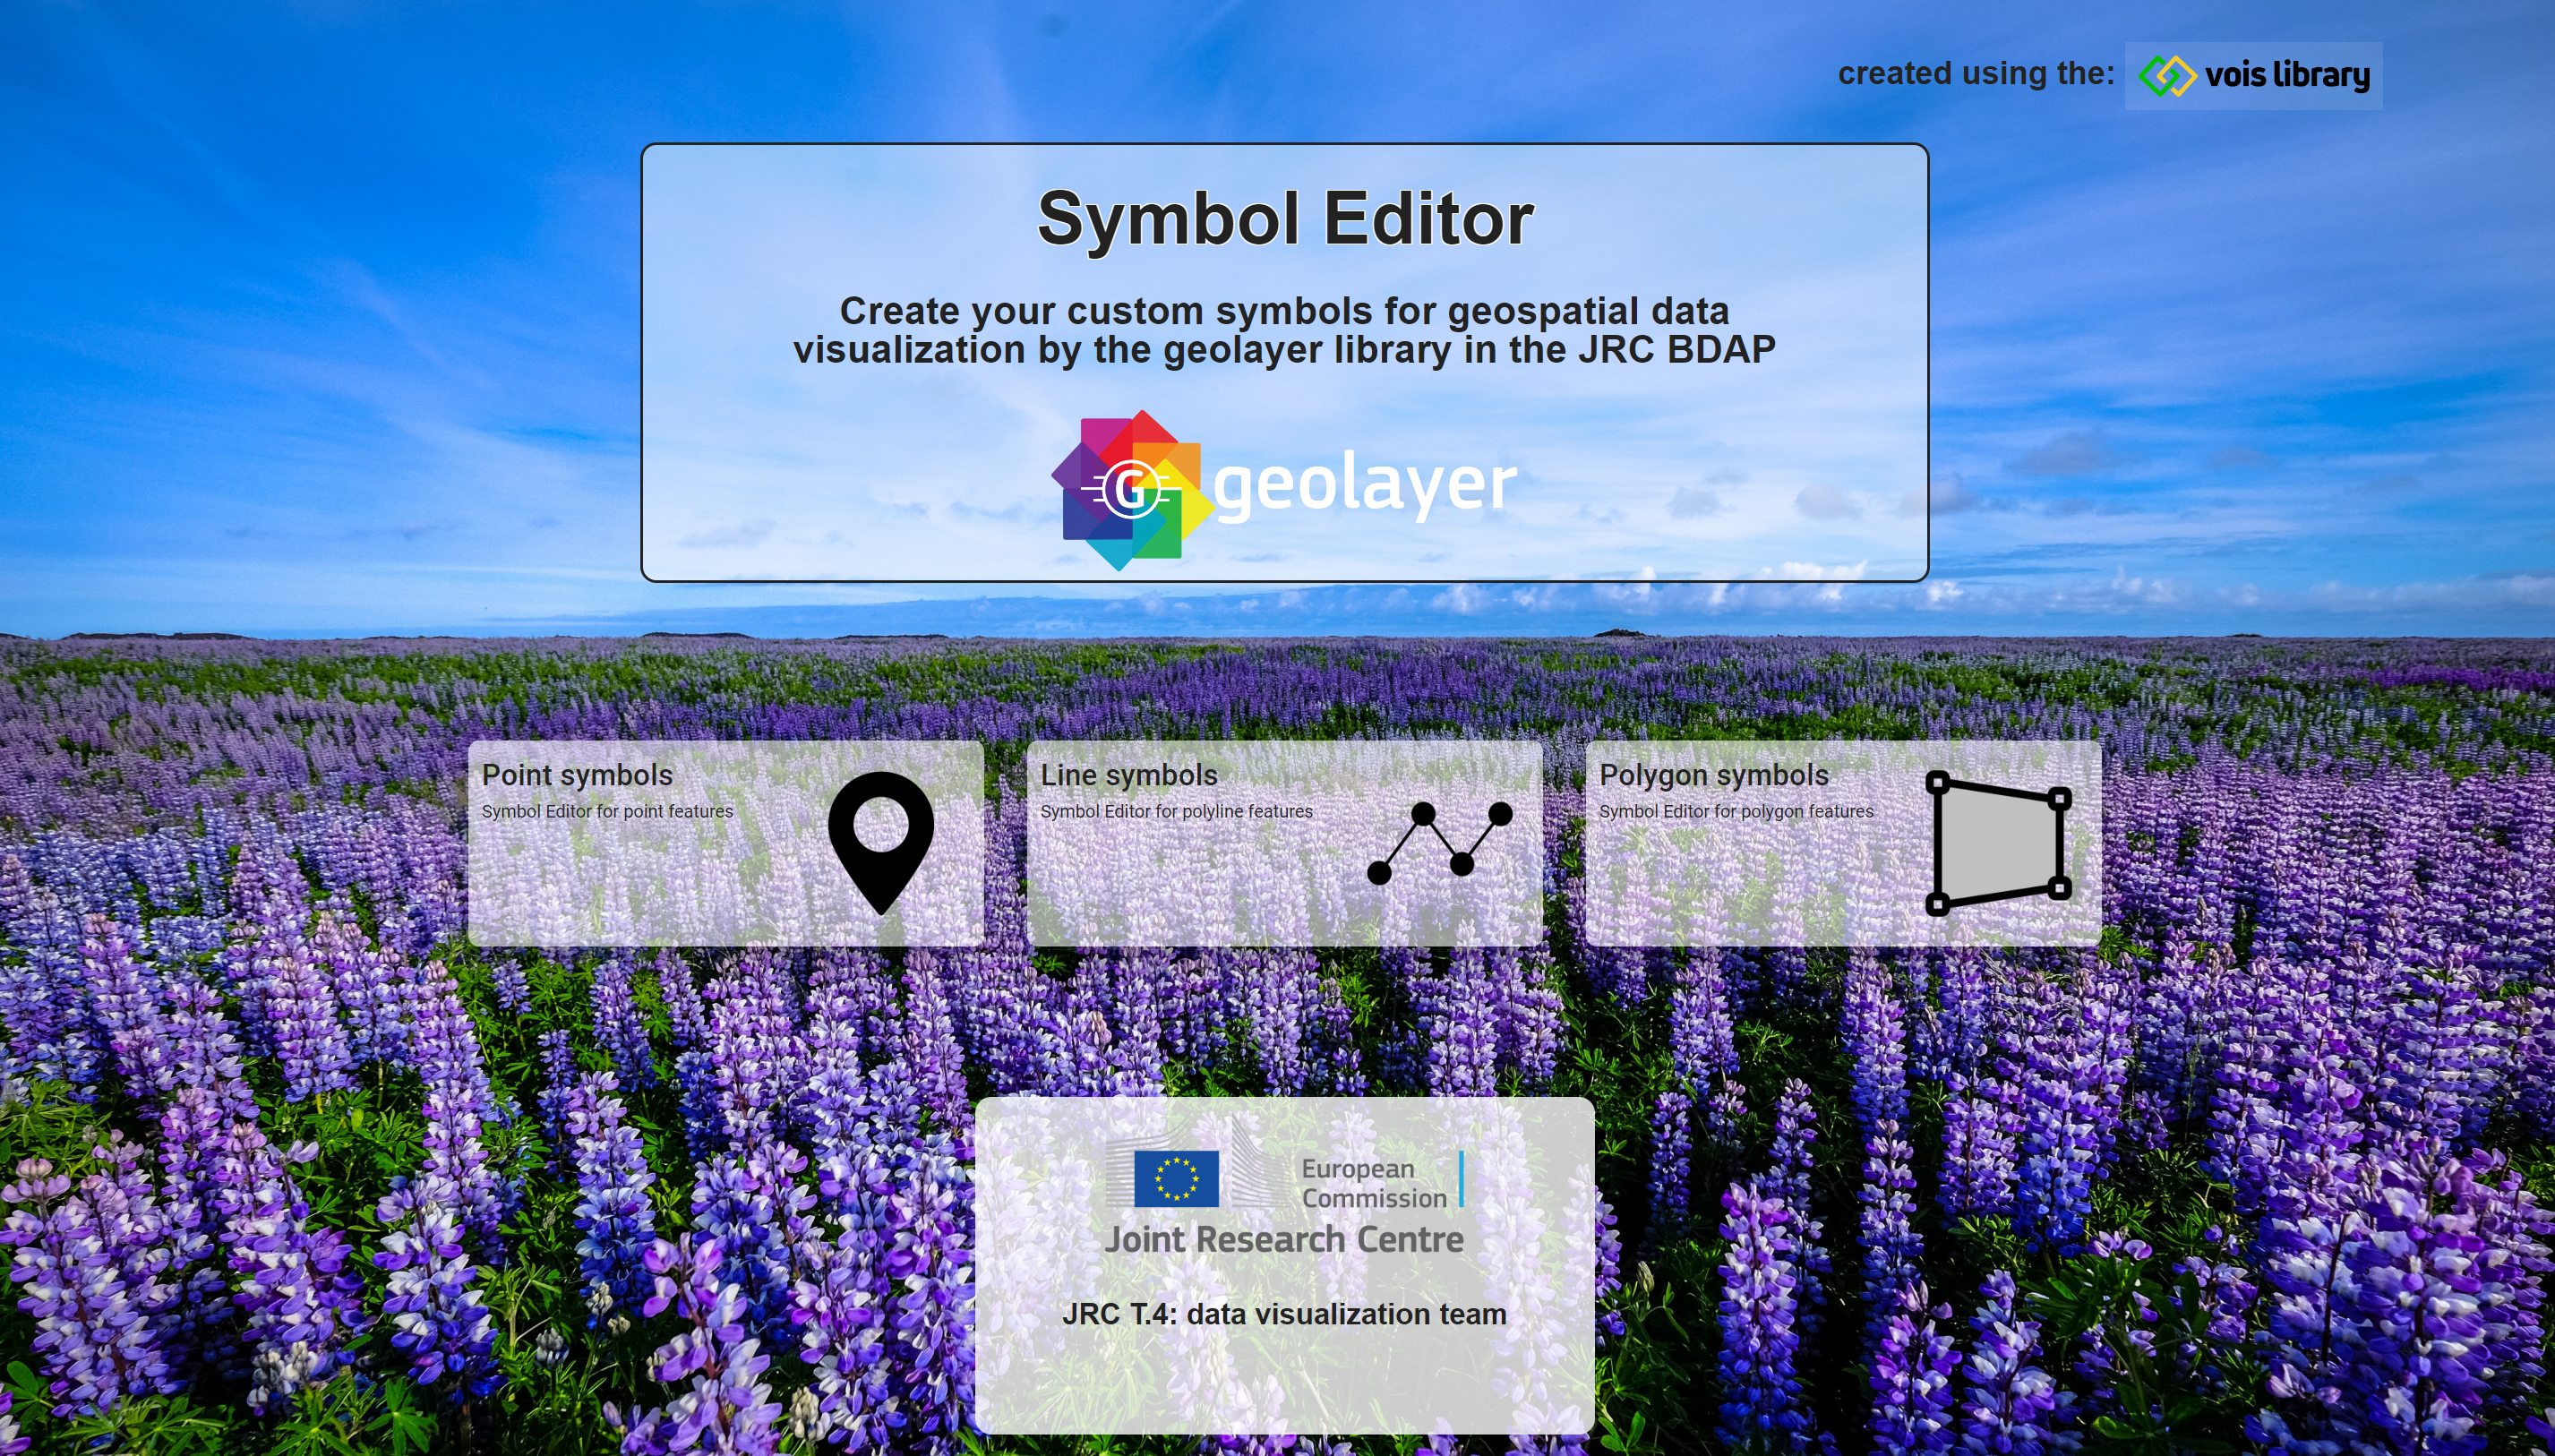
To help users of the geolayerBDAP library to create symbols for their vector datasets display, an online tool was developed and deployed on the Microsoft Azure Cloud: the Symbol Editor
Here is a screenshot of the tool:
This web application can visually build symbols for points, polylines and polygons features. For each symbol, one or more layer(s) can be created, thus overlapping different descriptors to the visual representation of the features.
This is the interface for creating point symbols:

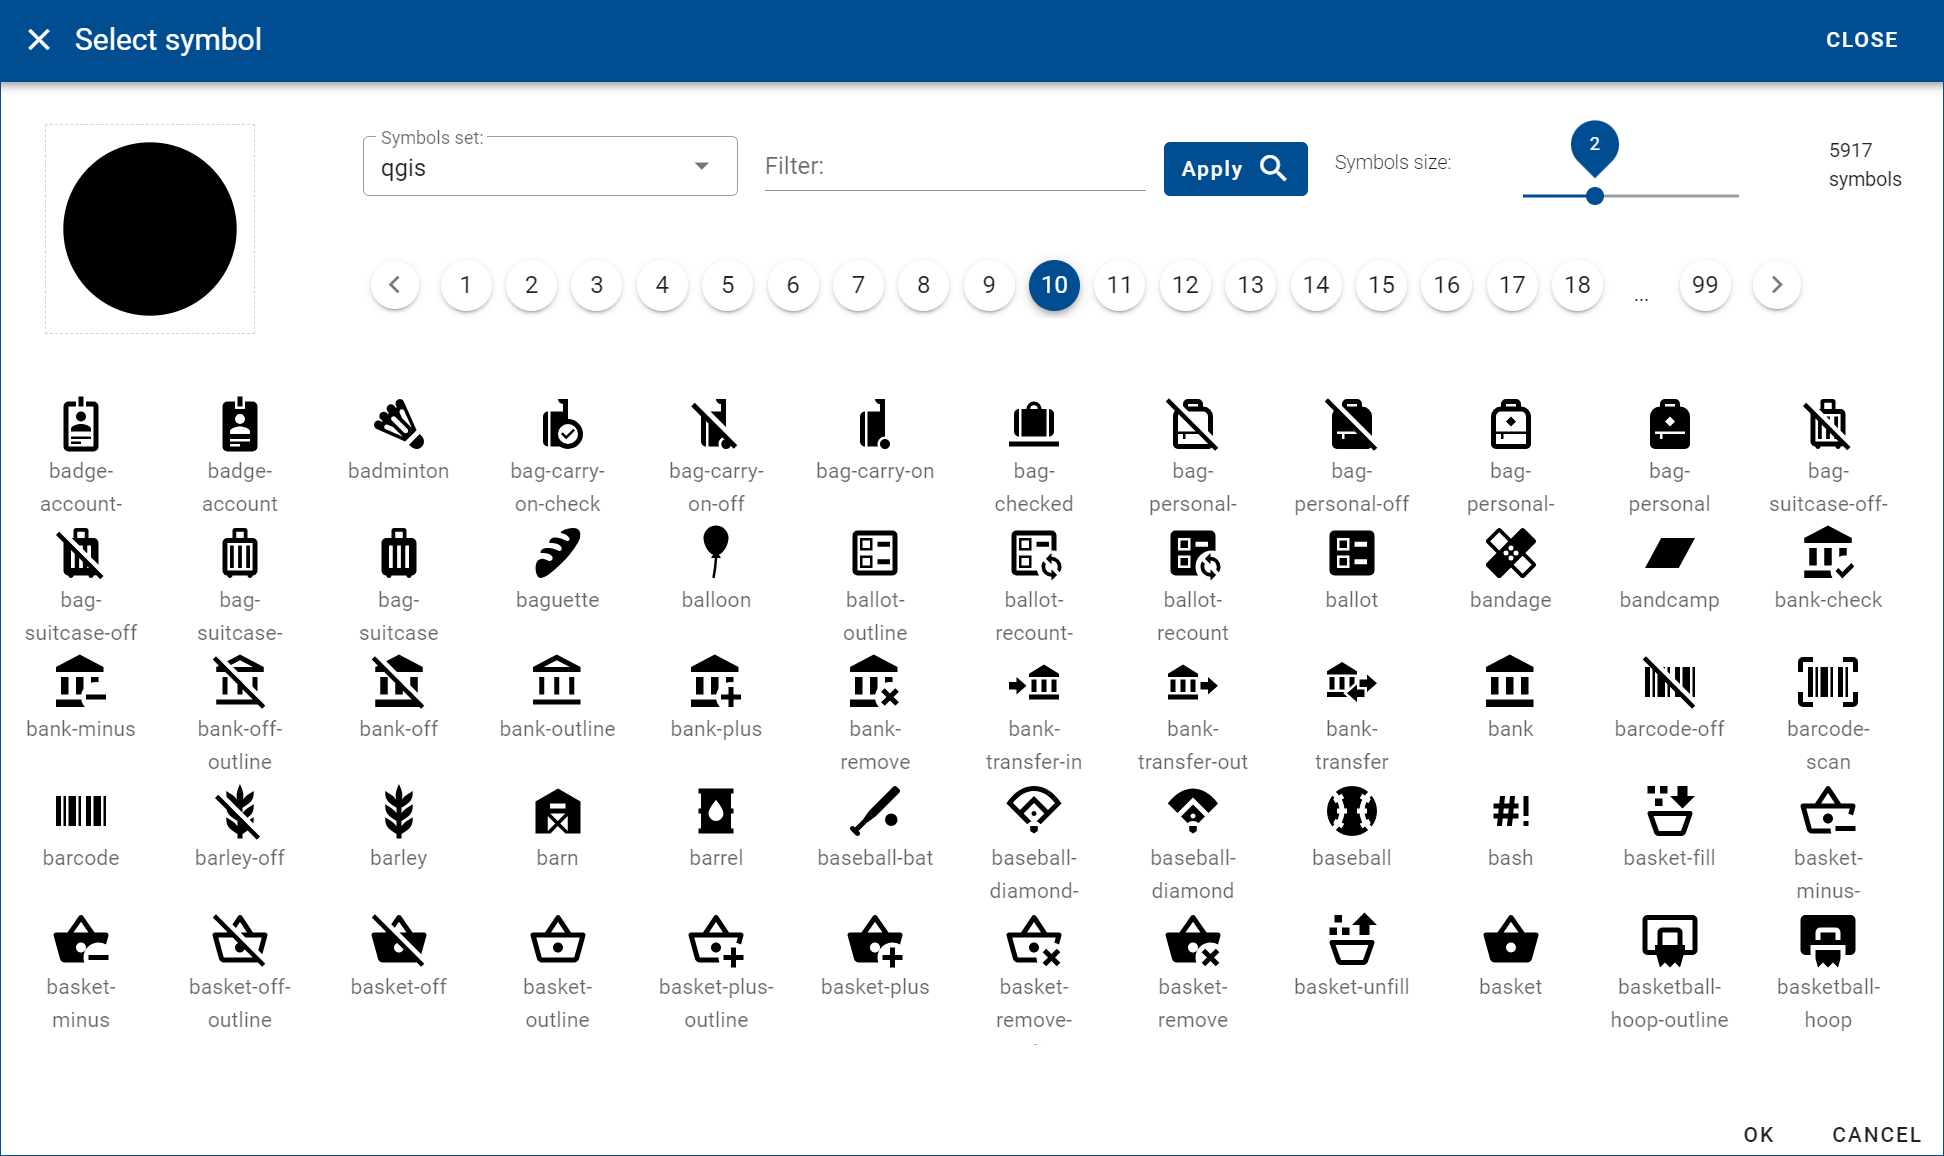
A vast selection of marker symbols can be browsed and searched to be inserted in the point symbol:
This is the interface for creating polyline symbols:

This is the interface for creating polygon symbols:

Symbols can be saved to the local computer in json format or uploaded from there.
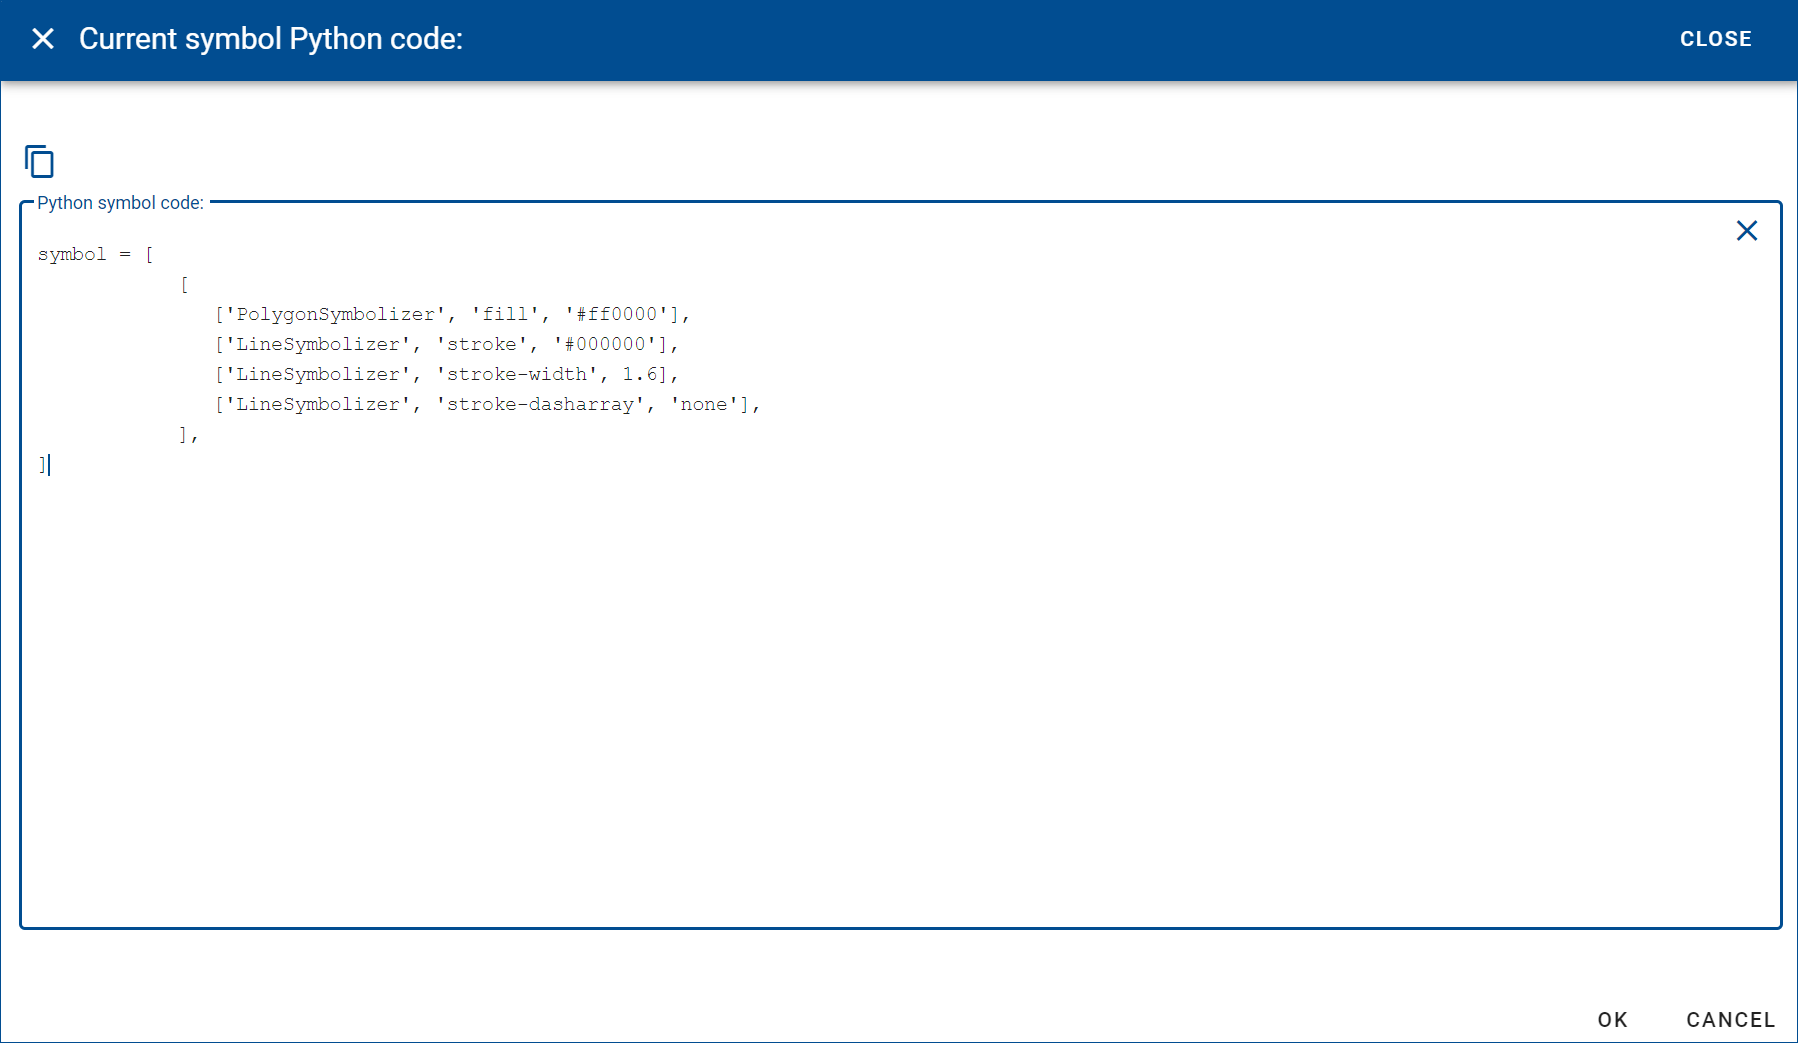
After the visual creation of a symbol, by clicking on the right button on top of the symbol preview, it is possible to view the Python code that correspond to the created symbols and copy the lines to insert them directly into a JupyterLab notebook: